My Journey Setting Up an Avalanche Validator - More Than Meets the Eye
Recently, I took on a challenge: deploy, monitor, and operate an Avalanche Fuji Testnet validator node. On paper, it seemed relatively straightforward, especially with a solid DevOps background. My initial plan? Leverage Ansible and Docker for a quick, automated deployment. Easy, right? Well, the journey turned out to be far more instructive than I initially anticipated.
The Initial Plan: Automation First
As a firm believer in Infrastructure as Code (IaC), my immediate thought was automation. Ansible would handle the server setup and configuration, and Docker would provide a consistent environment for the avalanchego node. I sketched out the playbooks, templated the configuration files (docker-compose.yml, node_config.json), and felt confident I could get a node up and running quickly.
Early Hurdles: The Devil’s in the Details
While the Ansible and Docker setup itself went smoothly (after a few typical playbook debugging cycles), the practical steps of interacting with the Avalanche network presented the first set of small, but necessary, hurdles.
Getting Testnet Funds: The official faucet requires a mainnet balance for anti-spam, which I didn’t readily have available. Thankfully, with a bit of research (and AI assistance), I found alternative faucets and discount codes (like
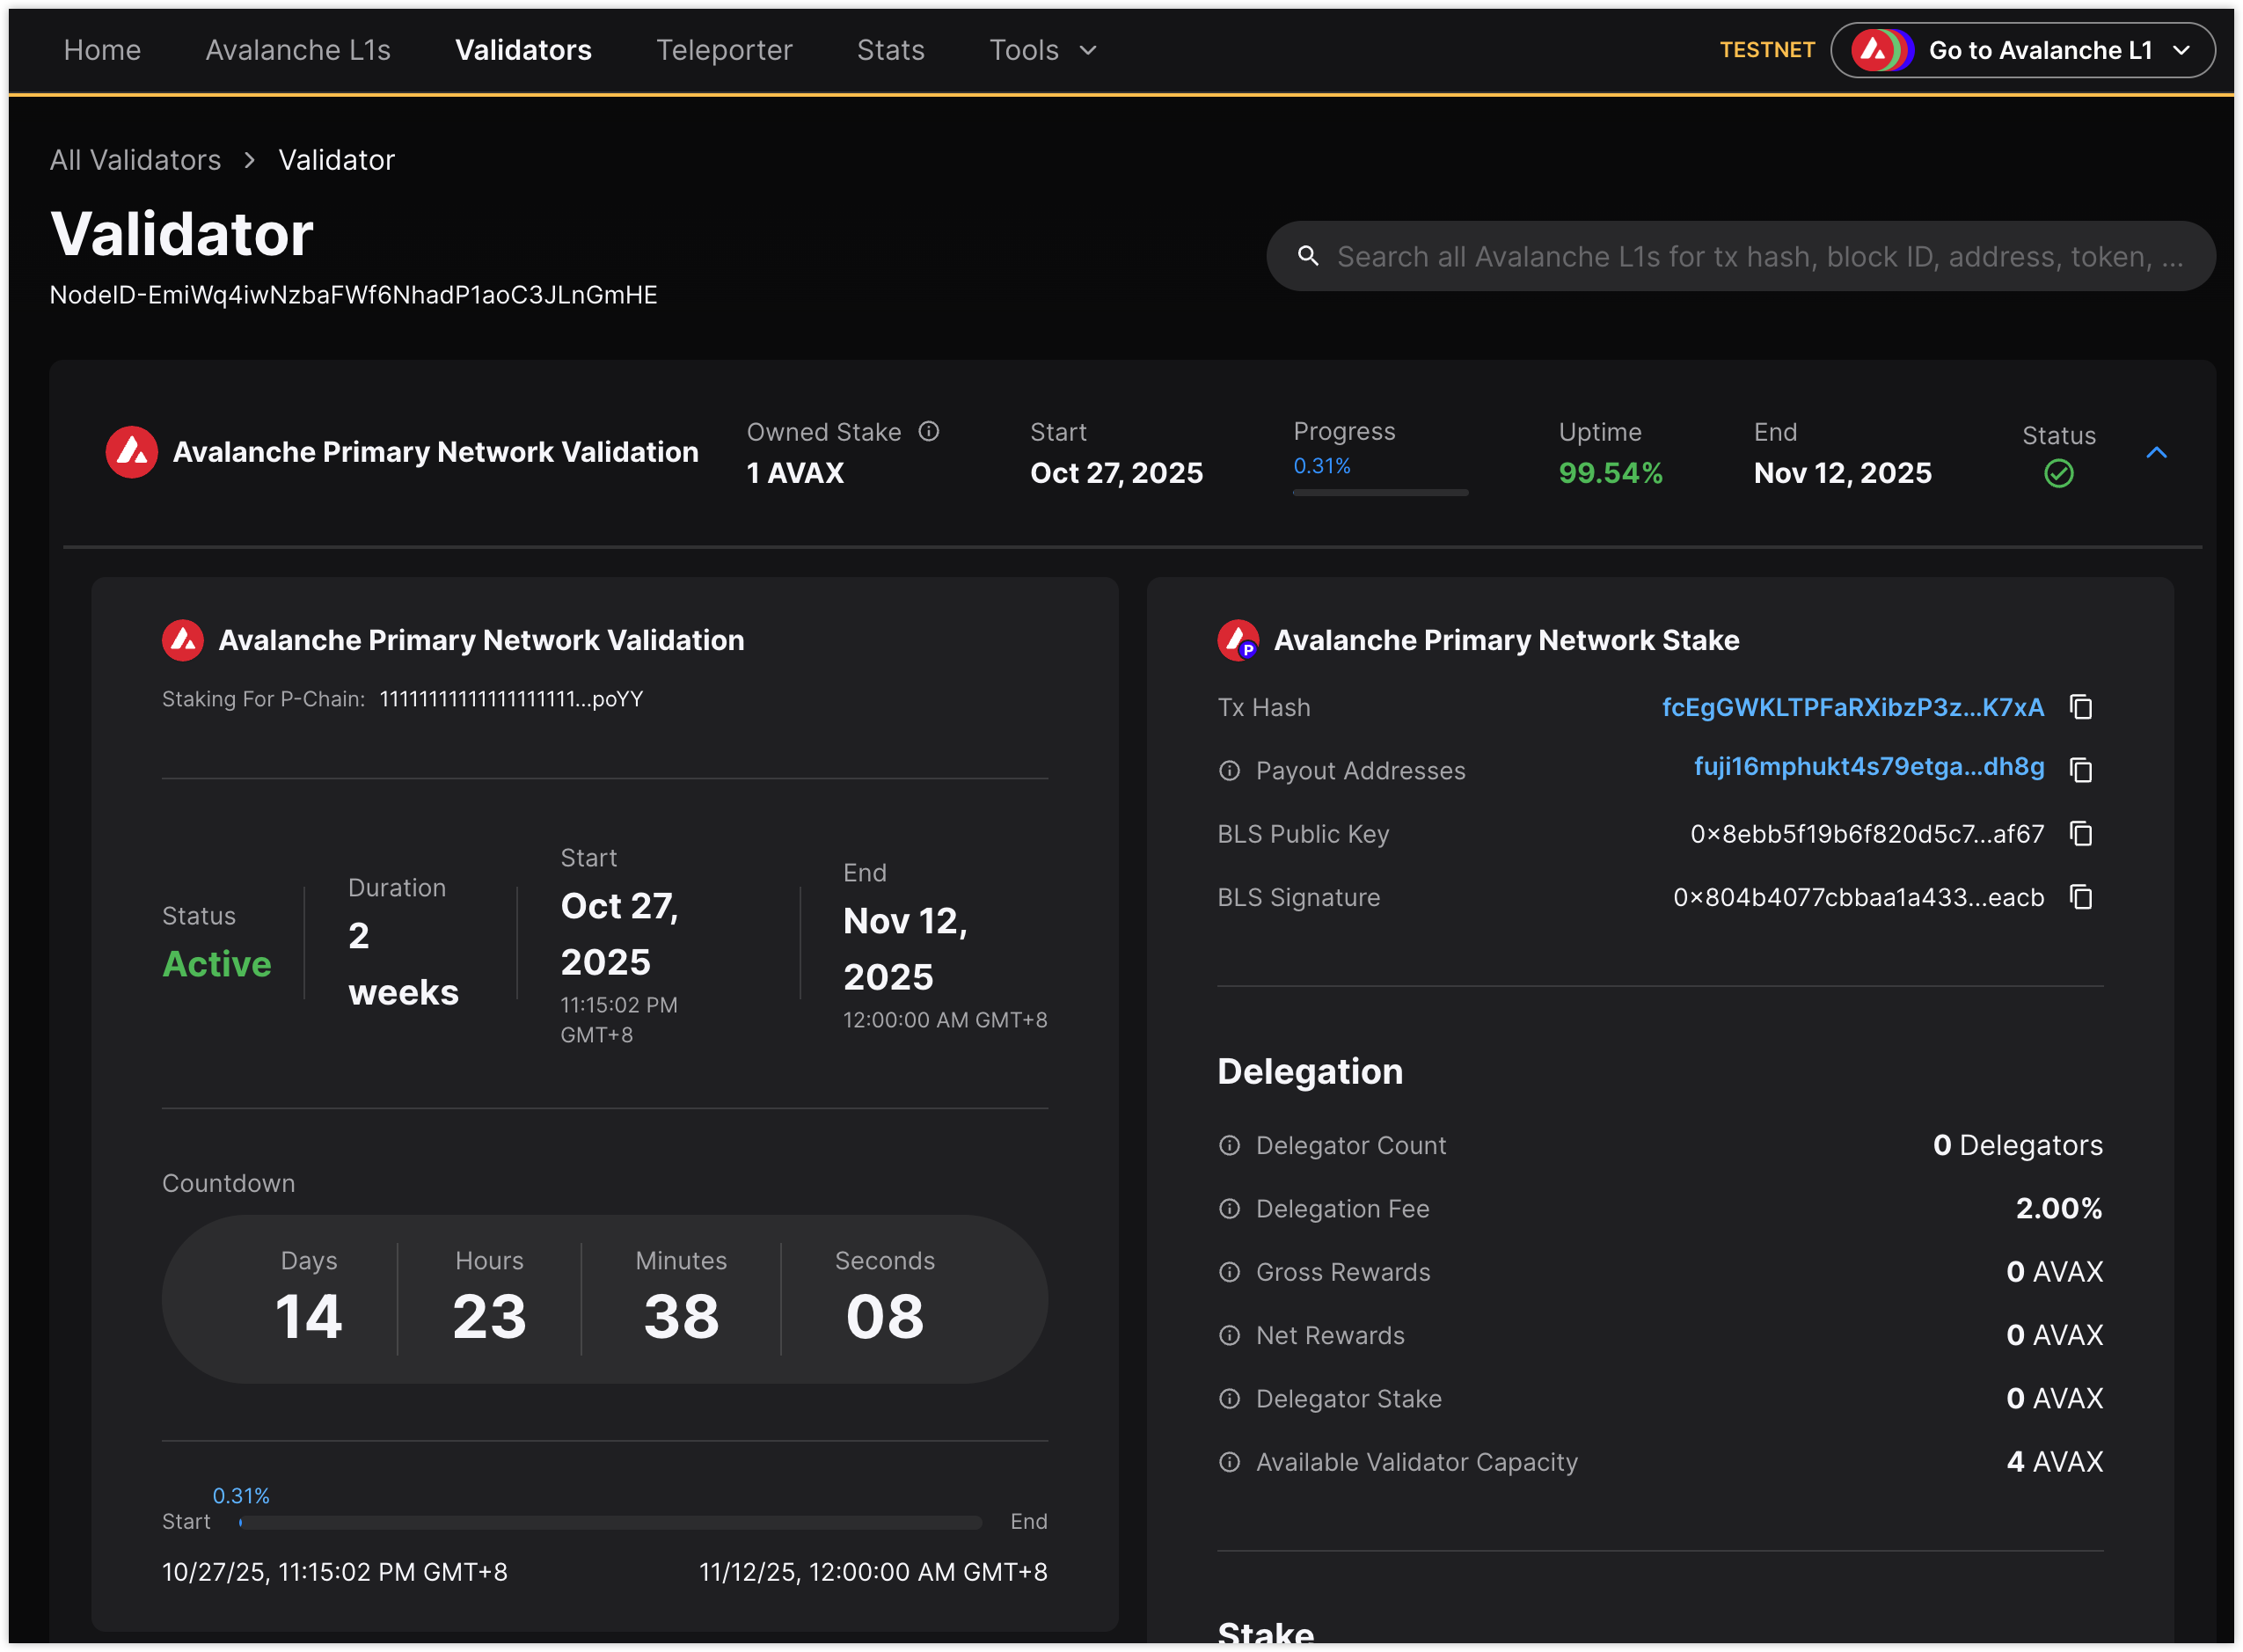
avalanche-academyfor the Core Wallet faucet) specifically designed for developers, allowing me to get the necessary Fuji AVAX.Registration Nuances: Registering the node wasn’t just a single click either. It involved understanding the C-Chain vs. P-Chain distinction, performing a cross-chain transfer (using a specific workflow within the Core Wallet, not the main bridge button!), and retrieving the NodeID and the crucial BLS Proof-of-Possession keys (which I eventually found logged during node startup after some API endpoint confusion).
These steps weren’t fundamentally difficult, especially with AI tools available to quickly answer specific questions, but they highlighted that even “simple” tasks require careful attention to the specific procedures of the blockchain network.
The Real Challenge: Stability and Health
Getting the node running was one thing; keeping it healthy and accessible proved to be the real challenge. After the initial deployment and successful registration (albeit with a mistaken short duration initially), I woke up the next morning to find the validator showing as accessible=no and online=no on the explorer, eventually leading to a benched=yes status.
This kicked off an extensive troubleshooting process:
Firewall Checks: Verified AWS Security Groups allowed port 9651 (using
ncand external port checkers). Confirmedufwwas inactive.Clock Synchronization: Ensured the system time was correctly synced using
chrony(timedatectl status).IP Address Verification: Confirmed the node was advertising the correct public IP (
info.ipmatchedcheckip.amazonaws.com).Resource Monitoring: Checked CPU (
htop), Disk I/O (iostat), and Memory – all were well within limits.Log Analysis: Dug through
docker logsfor network, consensus, or handshake errors.iptablesReview: Inspected Docker’siptablesrules, which appeared standard.Docker Restarts: Restarted both the container and the Docker daemon multiple times.
Despite confirming all the usual suspects were okay, the accessible=no status persisted for the Dockerized node. Frustratingly, the internal health.health API often reported healthy=true (sometimes with a subnets not bootstrapped error during startup phases, which is normal), highlighting a discrepancy between the node’s internal state and how the rest of the network perceived it.
Shifting Strategy: Back to Basics with Native Deployment
After exhausting troubleshooting options on the Docker setup (and even considering deploying a completely new Dockerized node with a fresh NodeID), I decided to pivot. Perhaps there was a subtle interaction with Docker’s networking or environment that I was missing. I switched to deploying the avalanchego binary directly on the host using systemd, closely following the official Avalanche documentation.
This wasn’t without its own learning curve. Native deployment requires careful management of binaries, configuration file locations, service definitions, and user permissions. Even following the docs, the node initially came up but still showed as unhealthy (accessible=no). I sought help on the official Discord, but didn’t find the support particularly effective in diagnosing this specific issue.
Ultimately, after ensuring the native setup was correct according to the docs and still facing the accessible=no problem, I performed a full server reboot. Surprisingly, after the reboot, the native node started reporting as accessible=yes and online=yes on the Explorer. While I’m hopeful it remains stable, only time will tell.
Key Takeaways: Automation, Docs, and Monitoring
This whole experience reinforced several core DevOps principles and provided valuable insights:
Automation is Non-Negotiable: Although I switched to native deployment, having the initial Ansible scripts made iterating and troubleshooting much faster. Rebuilding or reconfiguring manually would have been incredibly tedious. The need to automate becomes even clearer when considering managing multiple nodes or different environments. Infrastructure as Code isn’t just theory; it’s essential for sanity and scalability.
Trust, But Verify (Especially Docs): The official documentation proved invaluable, especially for the native setup. While community support can be hit-or-miss, the official docs are generally the most reliable source of truth. However, even docs can have nuances or slight inaccuracies (like the initial confusion over the actual minimum staking duration on Fuji).
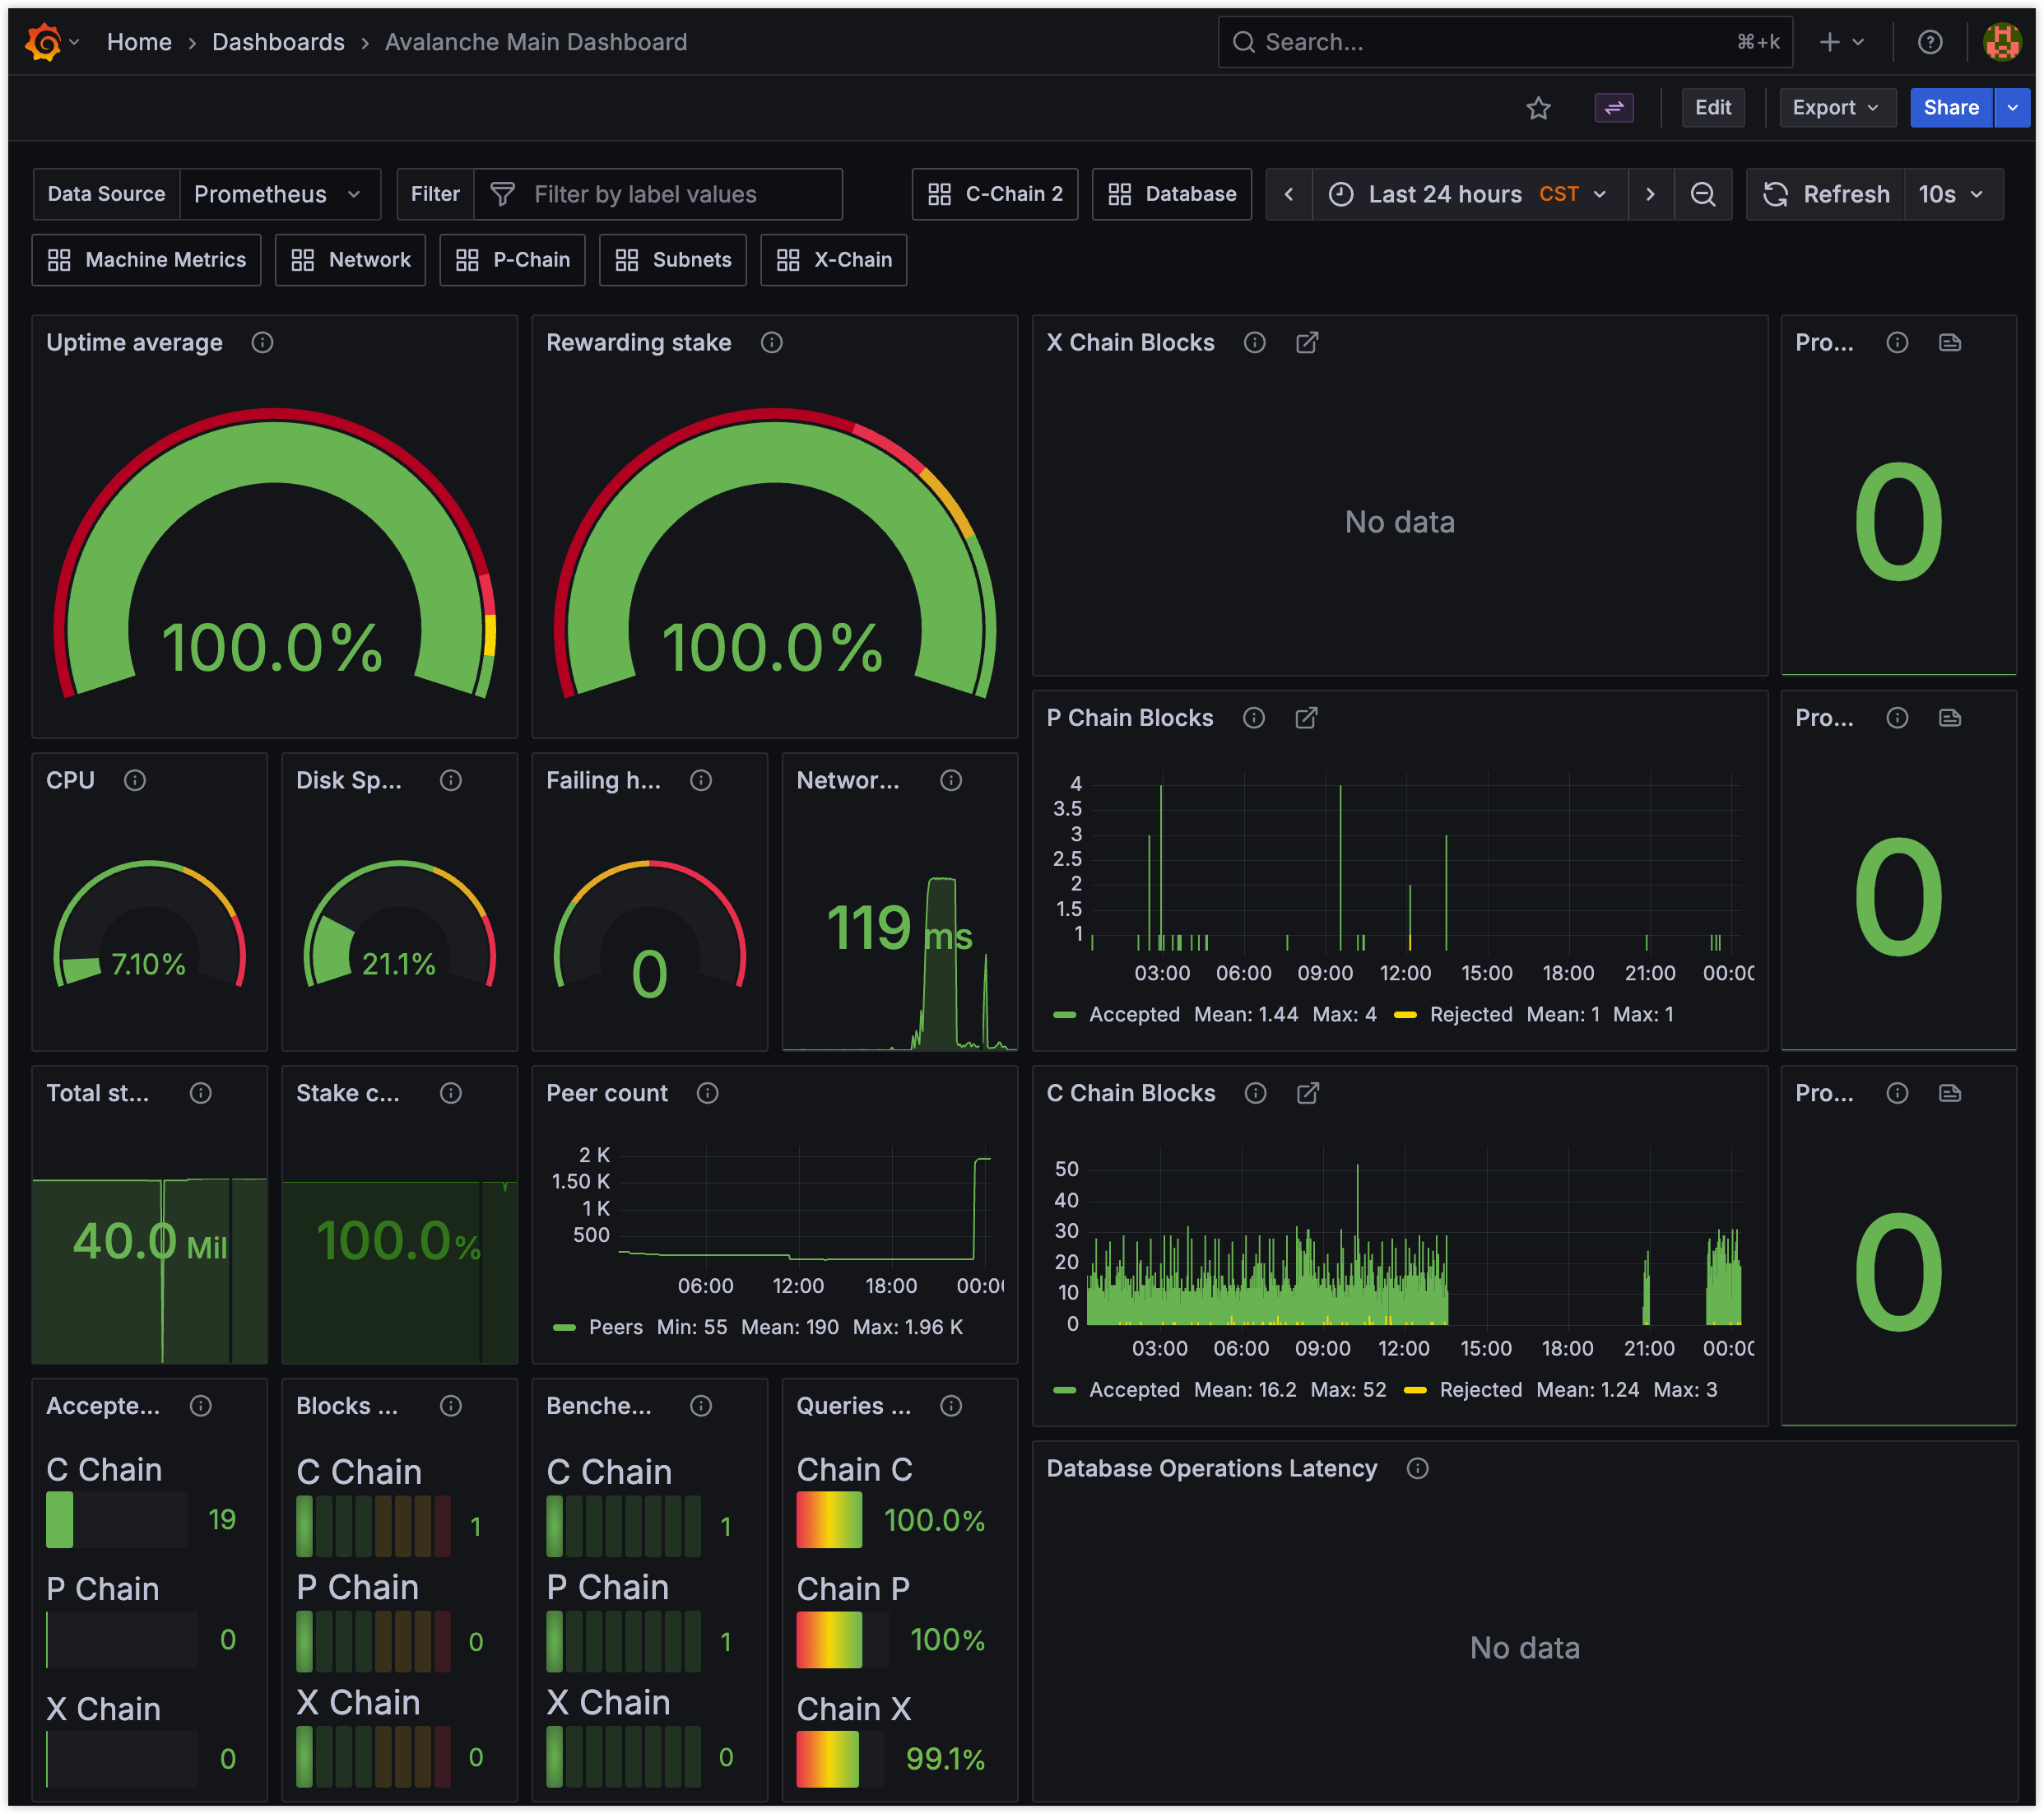
Monitoring: Follow the Experts: I initially deployed Prometheus and Grafana alongside the Docker setup. While building custom monitoring is possible, I quickly realized that leveraging the official Grafana dashboard and understanding the metrics it expects (including those from
node_exporterfor host stats, which my simple Docker setup lacked visibility into) is far more efficient for standard tasks. Unless monitoring is your primary job, stick close to the official recommendations. Reinventing the wheel here is time-consuming with limited return for a basic setup.Web3 Concepts Demystified: Beyond the technical hurdles, this challenge was a fantastic, hands-on introduction to practical blockchain concepts like Layers (L1/L2), Networks, specific Chain functions (P/C/X), Subnets, staking mechanics, and the importance of network health metrics (uptime, accessibility).
Conclusion
While deploying the validator was more challenging than expected, it was an incredibly rewarding learning experience. The process highlighted the gap between simple deployment and achieving sustained operational stability in a decentralized network. The troubleshooting journey, though frustrating at times, deepened my understanding of node operations, networking, and the importance of robust automation and monitoring.
All the commands, Ansible scripts, configuration templates, and detailed notes I took during this process are available in my GitHub repository: https://github.com/tobyqin/avalanche-validator-automation. Feel free to check it out!
Thanks for the challenge! It was genuinely fun and insightful.